Year of publication
Contents
Year of publication#
Primary research questions:#
The notebook partly answers the following research question:
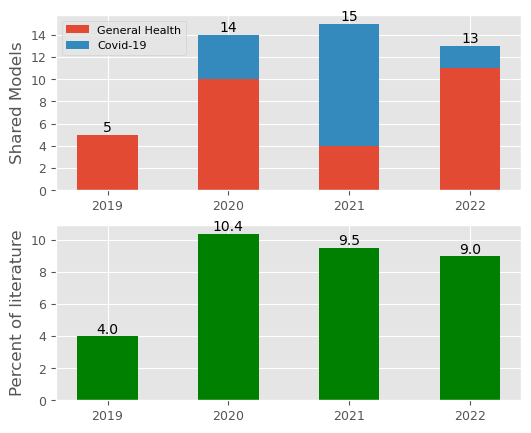
How is sharing affected by FOSS, Covid-19, publication type and year of publication?
Specifically we look at the number of shared models split into general health and Covid-19 subgroups. We also analyse how the number of shared models as a proportion of the literature.
1. Imports#
1.1. Standard Imports#
import pandas as pd
import numpy as np
import matplotlib.pyplot as plt
from matplotlib.ticker import MaxNLocator

# for converting svg to tif
from PIL import Image

# set up plot style as ggplot
plt.style.use('ggplot')
1.2 Imports from preprocessing module#
# function for loading full dataset
from preprocessing import load_clean_dataset
2. Constants#
FILE_NAME = 'https://raw.githubusercontent.com/TomMonks/' \
    + 'des_sharing_lit_review/main/data/share_sim_data_extract.zip'

RG_LABEL = 'reporting_guidelines_mention'
NONE = 'None'
WIDTH = 0.5
3. Functions#
3.1. Functions to create summary statistics#
Two functions are used together in order to generate the high level results by year.
high_level_metrics- takes a subgroup of the dataset and generates summary statistics and countsanalysis_by_year- loop through the years passing each tohigh_levle_metricsand concatenates datasets at the end.
def high_level_metrics(df, name='None'):
    '''A simple high level summary of the review.

    Returns a dict containing simple high level counts
    and percentages in the data#

    Params:
    -------
    df: pd.DataFrame
        A cleaned dataset.  Could be overall or subgroups/categories

    Returns:
    --------
        dict
    '''
    results = {}
    included = df[df['study_included'] == 1]
    available = included[included['model_code_available'] == 1]
    results['n_included'] = len(included[included['study_included'] == 1])
    results['n_foss'] = len(included[included['foss_sim'] == '1'])
    results['n_covid'] = len(included[included['covid'] == 1])
    results['n_avail'] = len(included[included['model_code_available'] == 1])
    results['n_foss_avail'] = len(available[available['foss_sim'] == '1'])
    results['n_covid_avail'] = len(available[available['covid'] == 1])
    results['per_foss'] = results['n_foss'] / results['n_included']
    results['per_covid'] = results['n_covid'] / results['n_included']
    results['per_avail'] = results['n_avail'] / results['n_included']
    results['per_foss_avail'] = results['n_foss_avail'] / results['n_foss']

    # fix for 2019 as `n_covid` = 0
    if results['n_covid'] > 0:
        results['per_covid_avail'] = \
            results['n_covid_avail'] / results['n_covid']
    else:
        results['n_covid_avail'] = 0.0
    results['reporting_guide'] = \
        len(included[included['reporting_guidelines_mention'] != 'None'])
    results['per_reporting_guide'] = \
        results['reporting_guide'] / results['n_included']
    return pd.Series(results, name=name)
def analysis_by_year(df_clean, decimals=4):
    '''
    Conducts a high level analysis by year of publication
    2019-2022

    Params:
    -------
    df_clean: pd.DataFrame
        Assumes a cleaned version of the dataset.

    Returns:
    -------
    pd.DataFrame
        Containing the result summary

    '''
    overall_results = high_level_metrics(df_clean, 'overall')
    year_results = []
    years = df_clean['pub_yr'].unique().tolist()
    for year in years:
        subset = df_clean[df_clean['pub_yr'] == year]
        year_results.append(high_level_metrics(subset, name=str(year)))
    year_results = [overall_results] + year_results
    year_results = pd.DataFrame(year_results).T.round(decimals)
    return year_results[sorted(year_results.columns.tolist())]
3.2 Functions to plot results#
get_subgroups_as_dataframes. Creates simpler to use DataFrame containing annual summaries of shared and non-shared models. These are split into non-covid and covid subgroups.plot_sharing_by_year- plot with 2 subfigures. The top subfigure is a stacked barchart of general health models + covid-19 models that have been shared by year of publication. The lower subfigure presents yearly results as a percentage of total papers included in the study.
def get_subgroups_as_dataframes(yr_summary):
    '''
    Create seperate subgroups from the yr_summary table
    and return as independent DataFrame objects.  The overall column
    is dropped and only annual figures are included.

    Makes assumptions about the naming of colunms in yr_summary.

    1. Non covid models shared
    2. Covid models shared
    3. Covid models not shared
    4. Non covid models shared.

    Params:
    -------
    yr_summary: pd.DataFrame
        Dataframe containing summary of metrics by publication year

    Returns:
    -------
    tuple
    non-covid shared, covid shared, covid not shared, non covid not shared.
    '''

    # non covid shared models
    non_covid_shared = yr_summary.T['n_avail'] \
        - yr_summary.T['n_covid_avail']

    # covid shared models
    covid_shared = yr_summary.T['n_covid_avail']

    # Covid models not shared
    covid_not_shared = yr_summary.T['n_covid'] \
        - yr_summary.T['n_covid_avail']

    # non covid not shared
    non_covid_not_shared = yr_summary.T['n_included'] \
        - yr_summary.T['n_avail'] - yr_summary.T['n_covid']

    # trim the overall column
    return non_covid_shared[:-1], covid_shared[:-1], covid_not_shared[:-1], \
           non_covid_not_shared[:-1]
def plot_sharing_by_year(n_general_models, n_covid_models,
                         per_models, xlabels, width=WIDTH, grid=True,
                         figsize=(6, 5)):
    '''
    Plot the number of models shared by year of publication (in citation).

    In this function we split models into two subgroups: covid and non-covid
    Non-covid models are refered to as 'general health models'

    The function creates a figure with two subplots.

    Subplot 1: A stacked barchart of general health models (non covid)
    + covid-19 models that have been shared by year of publication.  A legend is
    provided to distinguish between general and covid models.

    Subplot 2: A bar chart expressing the total number of shared models as a
    percentage of the number of included studies.

    Params:
    -------
    n_general_models: pd.DataFrame
        Count of non covid-19 models that have been shared by year of pub.

    n_covid_models: pd.DataFrame
         Count of covid-19 models that have been shared by year of pub.

    per_models: pd.DataFrame
        Percent of total studies included that have been shared by year of pub.

    xlabels: list:
        The years that represent the x-axis

    width: float, optional (default=WIDTH)
        A parameter to manipulated the width of the bars (applies to both plots)

    grid: bool, optional (default=True)
        Display grid lines (applies to both subplots)

    figsize: tuple(int, int), optional (default=(6,5)
        The size of the figure.

    Returns:
    --------
    fig, ax

    '''
    fig, (ax1, ax2) = plt.subplots(nrows=2, sharex=False, figsize=figsize)

    # include x, y grid
    if grid:
        ax1.grid(ls='--', axis='y')
        ax2.grid(ls='--', axis='y')

    # plot one: stacked bar chart.  general health + covid models
    y1 = ax1.bar(xlabels, n_general_models,
                label='General Health', width=width)

    y2 = ax1.bar(xlabels, n_covid_models,
               label='Covid-19', bottom=n_general_models, width=width)

    _ = ax1.set_ylabel('Shared Models')
    _ = ax1.legend(ncols=1, loc='upper left', fontsize=8)

    # force integer values on y axis
    ax1.yaxis.set_major_locator(MaxNLocator(integer=True))

    # include x, y grid
    if grid:
        ax1.grid(ls='--', axis='y')
        ax2.grid(ls='--', axis='y')

    ax1.bar_label(y2)

    # set size of x, y ticks
    ax1.tick_params(axis='both', labelsize=9)
    ax2.tick_params(axis='both', labelsize=9)

    # plot 2: percentage available by year
    y2 = ax2.bar(xlabels, per_models * 100.0, label='All models',
                width=width, color='green')

    labels = [f'{m:.1f}' for m in (per_models * 100.0)]

    ax2.bar_label(ax2.containers[0], labels=labels)


    _ = ax2.set_ylabel('Percent of literature')

    return fig, (ax1, ax2)
def plot_all_subgroups_by_year(non_covid_shared, covid_shared,
                               per_models, non_covid_not_shared,
                               covid_not_shared,
                               xlabels, width=WIDTH, grid=True,
                               figsize=(6, 6)):
    '''
    Plot the number of models across subgroups by year of publication (in citation).

    In this function we split models into four subgroups: covid and non-covid
    and shared and non-shared.

    Non-covid models are refered to as 'general health models'

    The function creates a figure with two subplots.

    Subplot 1: A stacked barchart of unshared general health models (non covid)
    + unshared covid-19 + shared non-covid + shared covid that have been shared
    by year of publication.

    A legend is provided to distinguish between the four subgroups

    Subplot 2: A bar chart expressing the total number of shared models as a
    percentage of the number of included studies.

    Params:
    -------
    non_covid_shared: pd.DataFrame
        Count of non covid-19 models that have been shared by year of pub.

    covid_shared: pd.DataFrame
         Count of covid-19 models that have been shared by year of pub.

    non_covid_not_shared: pd.DataFrame
        Count of non covid-19 models that have NOT been shared by year of pub.

    covid_not_shared: pd.DataFrame
         Count of covid-19 models that have NOT been shared by year of pub.

    per_models: pd.DataFrame
        Percent of total studies included that have been shared by year of pub.

    xlabels: list:
        The years that represent the x-axis

    width: float, optional (default=WIDTH)
        A parameter to manipulated the width of the bars (applies to both plots)

    grid: bool, optional (default=True)
        Display grid lines (applies to both subplots)

    figsize: tuple(int, int), optional (default=(6,5)
        The size of the figure.

    Returns:
    --------
    fig, ax

    '''

    fig, (ax1, ax2) = plt.subplots(nrows=2, sharex=True, figsize=figsize)

    # include x, y grid
    if grid:
        ax1.grid(ls='--', axis='y')
        ax2.grid(ls='--', axis='y')

    # plot one: stacked bar chart.  general health + covid models
    y1 = ax1.bar(xlabels, non_covid_not_shared,
                label='Closed General', width=width)

    y2 = ax1.bar(xlabels, covid_not_shared,
                 label='Closed Covid-19', bottom=non_covid_not_shared,
                 width=width)

    y3 = ax1.bar(xlabels, non_covid_shared,
                 label='Open General',
                 bottom=non_covid_not_shared+covid_not_shared, width=width)

    y4 = ax1.bar(xlabels, covid_shared,
                 label='Open Covid-19',
                 bottom=non_covid_not_shared+covid_not_shared+
                 non_covid_shared, width=width)

    _ = ax1.set_ylabel('Models')

    _ = fig.legend(loc='upper left', ncol=2, bbox_to_anchor=(0.11, 1.0),
                   fontsize=9)

    # include x, y grid
    if grid:
        ax1.grid(ls='--', axis='y')
        ax2.grid(ls='--', axis='y')

    ax1.bar_label(y4)

    # set size of x, y ticks
    ax1.tick_params(axis='both', labelsize=9)
    ax2.tick_params(axis='both', labelsize=9)

    # plot 2: percentage available by year
    _ = ax2.bar(xlabels, per_models, label='All models',
                width=width, color='green')

    _ = ax2.set_ylabel('Percent of literature')

    return fig, (ax1, ax2)
4. Read in data#
clean = load_clean_dataset(FILE_NAME)
5. Results#
5.1 Overall summary table#
# overall
year_summary = analysis_by_year(clean)
year_summary
| 2019 | 2020 | 2021 | 2022 | overall | |
|---|---|---|---|---|---|
| n_included | 126.0000 | 135.0000 | 158.0000 | 145.0000 | 564.0000 |
| n_foss | 18.0000 | 21.0000 | 35.0000 | 27.0000 | 101.0000 |
| n_covid | 0.0000 | 9.0000 | 35.0000 | 25.0000 | 69.0000 |
| n_avail | 5.0000 | 14.0000 | 15.0000 | 13.0000 | 47.0000 |
| n_foss_avail | 5.0000 | 7.0000 | 10.0000 | 7.0000 | 29.0000 |
| n_covid_avail | 0.0000 | 4.0000 | 11.0000 | 2.0000 | 17.0000 |
| per_foss | 0.1429 | 0.1556 | 0.2215 | 0.1862 | 0.1791 |
| per_covid | 0.0000 | 0.0667 | 0.2215 | 0.1724 | 0.1223 |
| per_avail | 0.0397 | 0.1037 | 0.0949 | 0.0897 | 0.0833 |
| per_foss_avail | 0.2778 | 0.3333 | 0.2857 | 0.2593 | 0.2871 |
| per_covid_avail | NaN | 0.4444 | 0.3143 | 0.0800 | 0.2464 |
| reporting_guide | 10.0000 | 21.0000 | 12.0000 | 29.0000 | 72.0000 |
| per_reporting_guide | 0.0794 | 0.1556 | 0.0759 | 0.2000 | 0.1277 |
5.3. Sharing of models by year of publication#
# Get the subgroups from the year by year results
non_covid_shared, covid_shared, covid_not_shared, \
           non_covid_not_shared = get_subgroups_as_dataframes(year_summary)
fig2, axs = plot_sharing_by_year(n_general_models=non_covid_shared,
                                 n_covid_models=covid_shared,
                                 per_models=year_summary.T['per_avail'][:-1],
                                 xlabels=year_summary.columns[:-1],
                                 grid=False)
# output the chart as .png for publication - temp svg format
fig2.savefig('fig2.svg', dpi=600, bbox_inches='tight')

# Open the SVG file with Pillow and save as TIFF
img = Image.open('fig2.png')
img.save('fig2.tiff')
5.4 All sharing subgroups by year of publication.#
fig, axs = plot_all_subgroups_by_year(non_covid_shared=non_covid_shared,
                                      covid_shared=covid_shared,
                                      per_models=year_summary.T['per_avail'][:-1],
                                      non_covid_not_shared=non_covid_not_shared,
                                      covid_not_shared=covid_not_shared,
                                      xlabels=year_summary.columns[:-1],
                                      grid=False)